nostalgeo wins the audience award at Apps For Europe
After winning AppsforGeo and AppsforFlanders, nazka's nostalgeo also won the audience prize at Apps for Europe.
read more
16 october 2025
On October 15 in Brussels, we showcased the beta version of the WIMBY interactive map, a critical new tool developed in the WIMBY project in collaboration with the consortium partners. This map is designed to combat the persisting “Not In My BackYard” (NIMBY) effect that often stalls vital wind energy deployment across Europe, by decreasing skepticism with empowerment and dissemination.
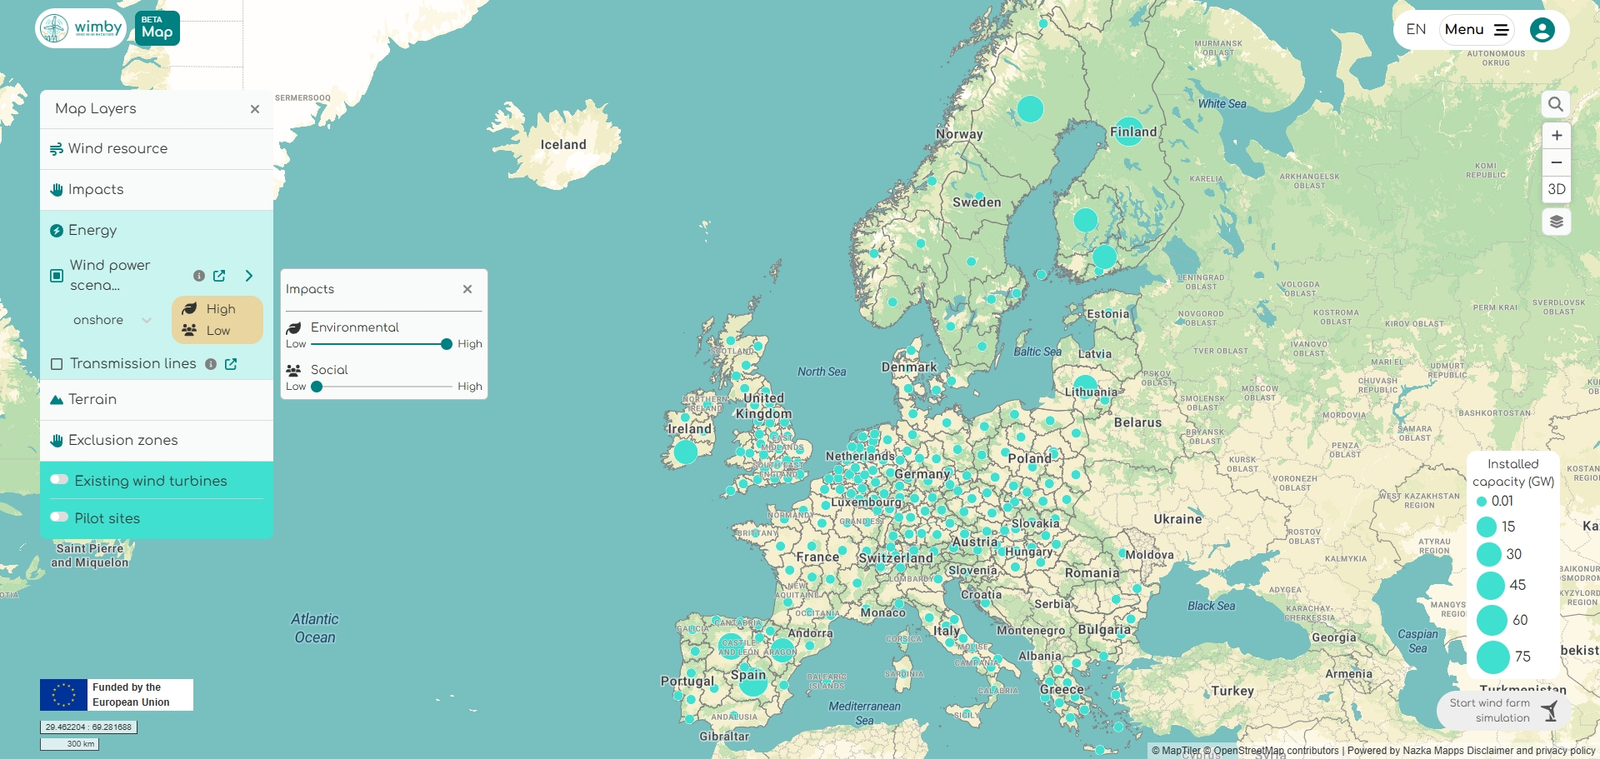
Two map modes: exploration and planning
The WIMBY map is built on the datasets and models realised in the project by partners to outline the constraints, impacts and enablers of wind turbine deployment in Europe. The tool enables two complementary modes to find locations with the highest potential and the lowest negative impact.
Mode 1: Exploration
This mode allows users to freely investigate wind power datasets on a continental scale. Users can visualise a wealth of wind-related layers, such as:
The exploration mode provides context why certain areas are better suited for wind energy than others and shows the different aspects to take into account.
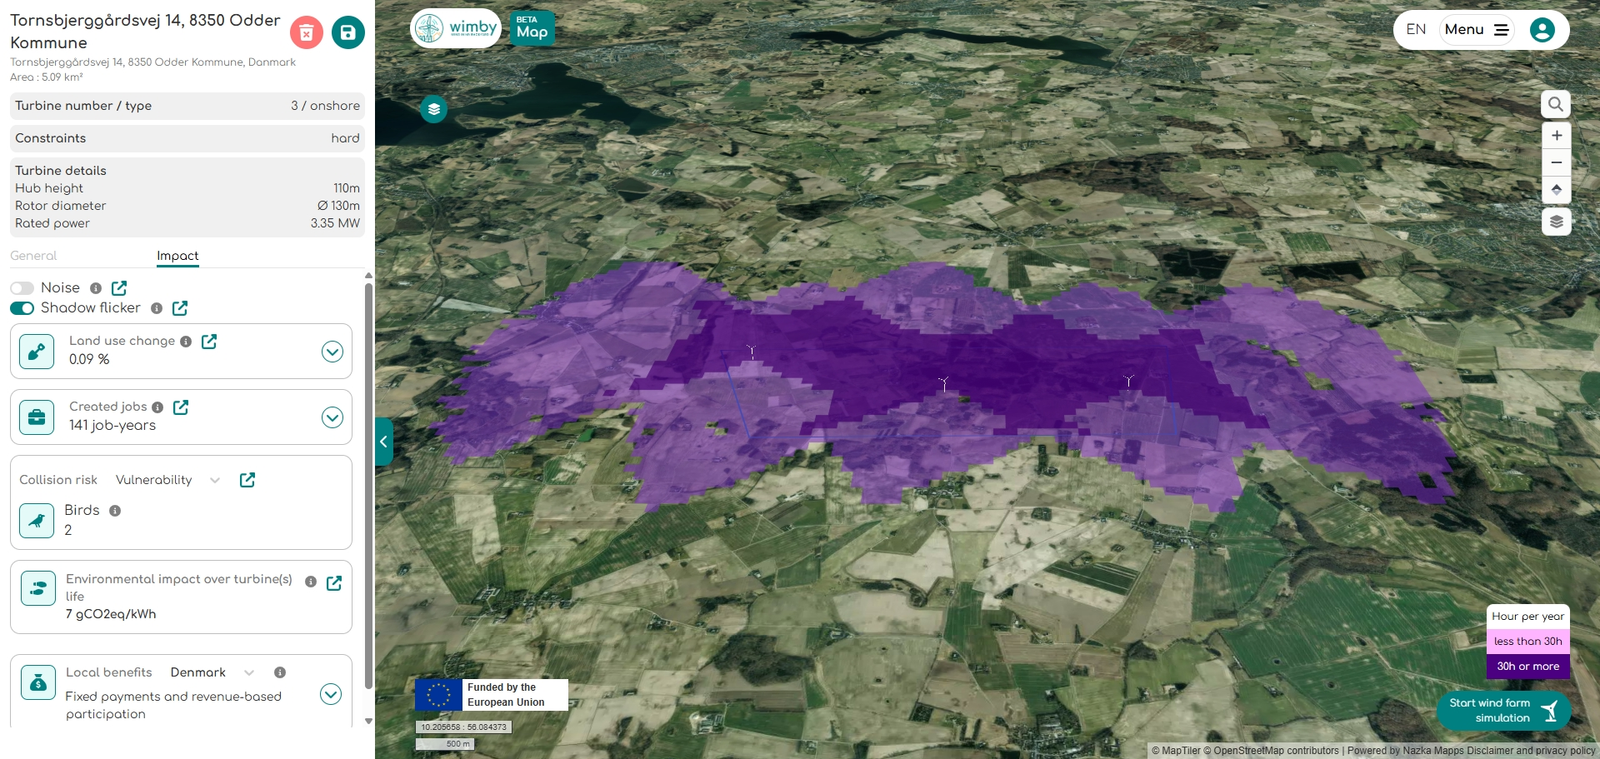
Mode 2: Planning
This is where the tool shifts from the international or regional level to a neighborhood scale. The planning mode allows users to simulate a hypothetical wind farm in an area of interest. The tool then:
By instantly quantifying the impacts and trade-offs, the planning mode objectifies the discussion, enabling stakeholders to engage in participatory decision-making based on data that is normally only available to experts. Users can share wind farm simulations with other stakeholders through a link or through the smart integration with the other tool of the WIMBY project: the general forum.
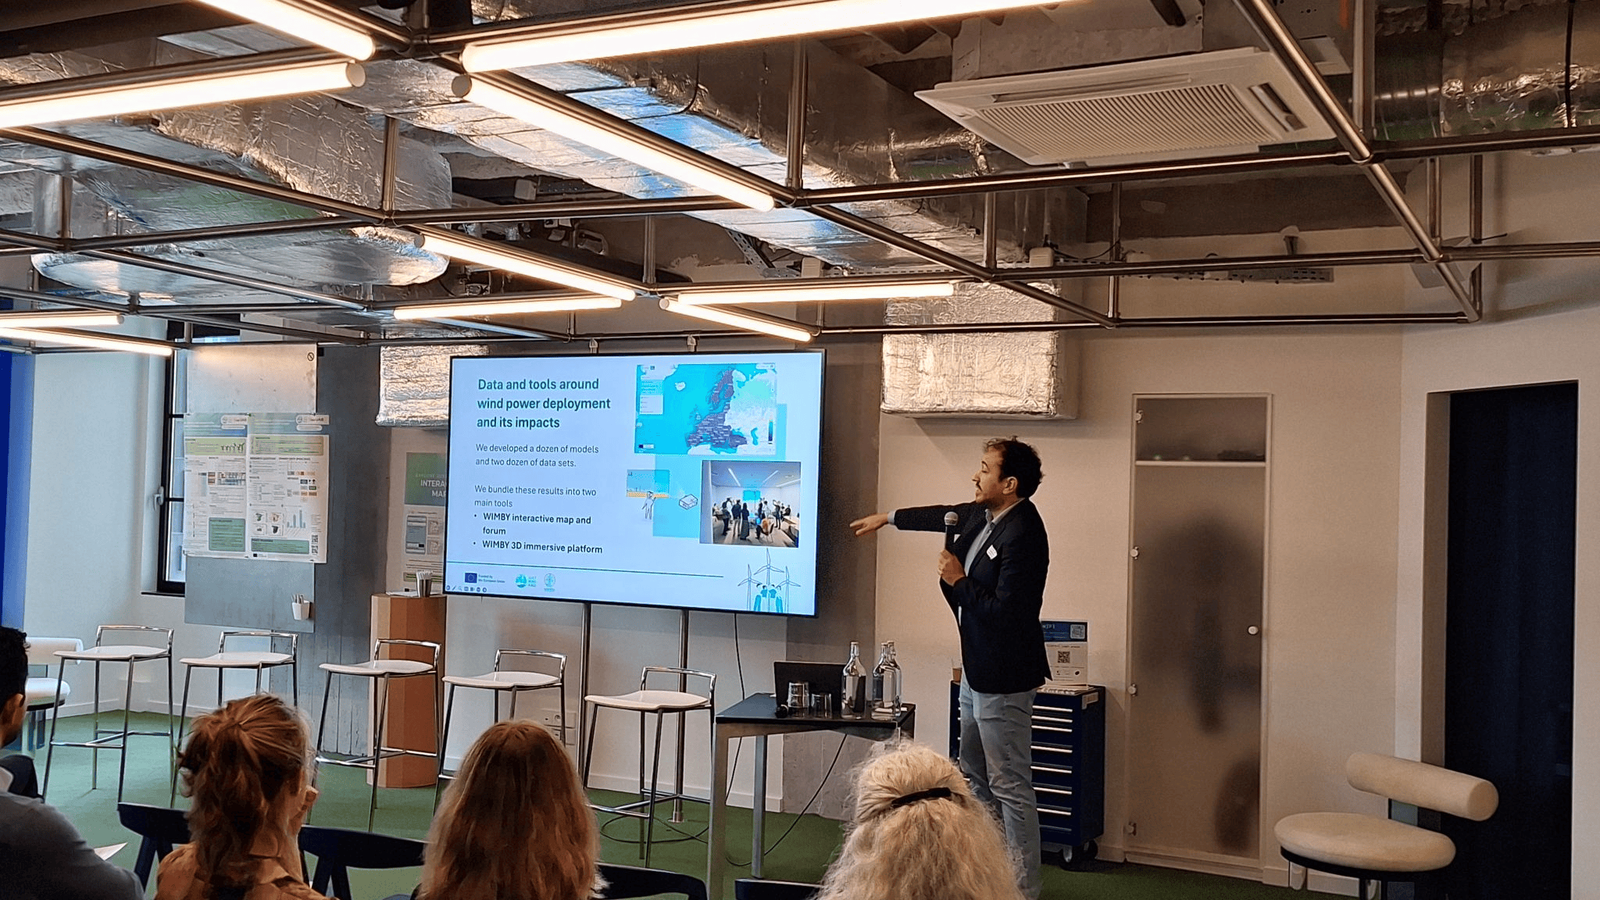
A succesful beta-version launch in Brussels
The unveiling of the beta version at the WIMBY final event marked a significant milestone. The map was presented to key stakeholders that offered interesting feedback and insights. The tool is now publicly available and ready to be tested, refined, and used. We will keep on improving the tool until the end of the project in December. We invite you to dive in and explore the future of wind energy planning.
Explore the WIMBY Map Beta: https://map.wimby.eu


